Introduction
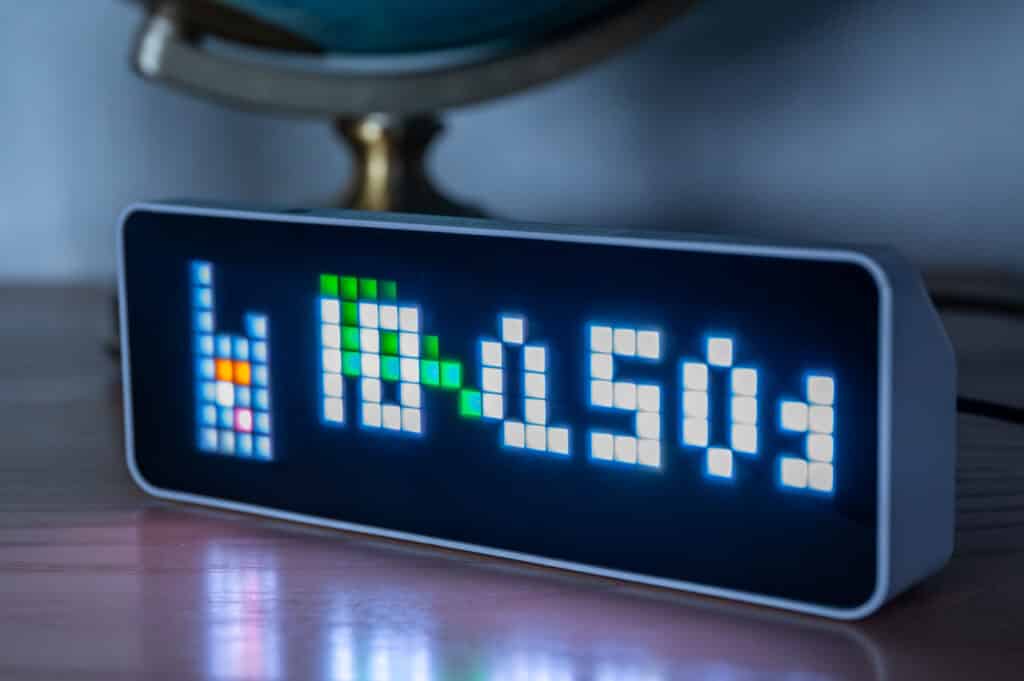
In amateur radio, good documentation of the QSOs made is essential. In addition to digital archiving, many radio amateurs also ask themselves how these statistics can be displayed in a visually appealing and clearly visible way. In my radio room, I have used the “Ulanzi TC001 Pixelclock” with the alternative firmware “Awtrix” for this purpose. This makes it possible to display various data on an LED display. In this article, I describe how I used Wavelog, ioBroker and Awtrix to realize an automatic display of my QSO statistics.
Hardware and Software
Für die Umsetzung dieses Projekts nutze ich folgende Komponenten:
- Ulanzi TC001 Pixelclock with alternative Firmware Awtrix
- Wavelog as Logboksoftware with API
- ioBroker as central platform for data handling
- JavaScript-Adapter within ioBroker for data storage and handling
Connection of Wavelog via the API
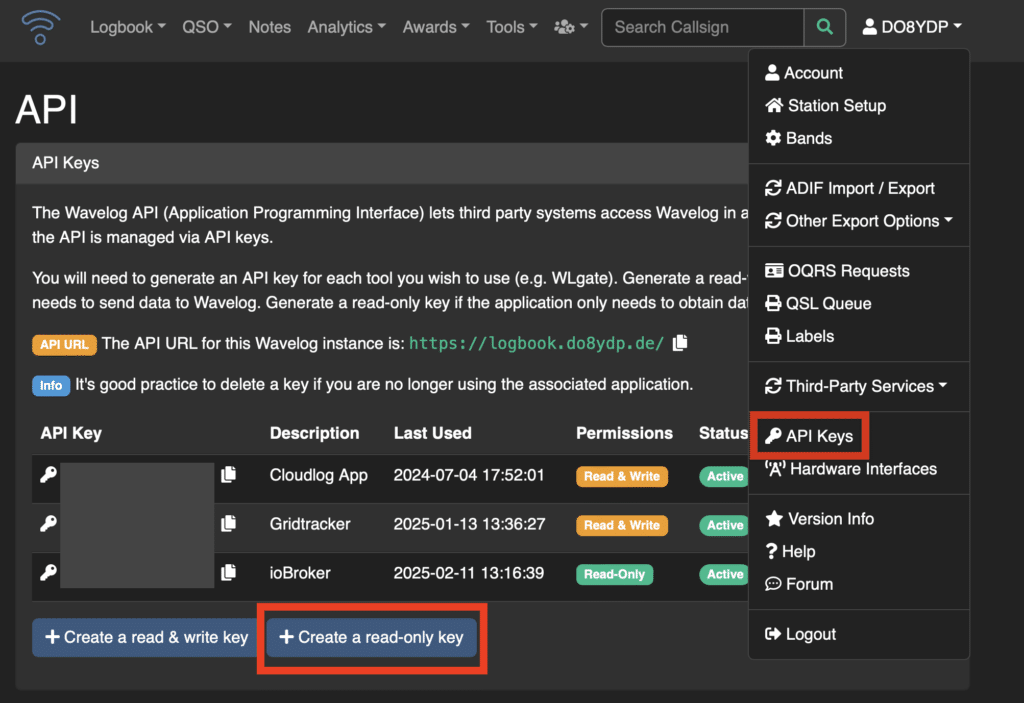
Thanks to Wavelog’s API, my logbook data can be retrieved automatically. To do this, a read-only API key is generated in Wavelog, which enables secure access to the QSO statistics. This is done in the following steps:
- Creation of an API key in Wavelog with read access.
- Note the URL to the API, your own station ID (usually “1”) and the API key.
- Implementation of a script in ioBroker that retrieves the data cyclically.
Integration in ioBroker
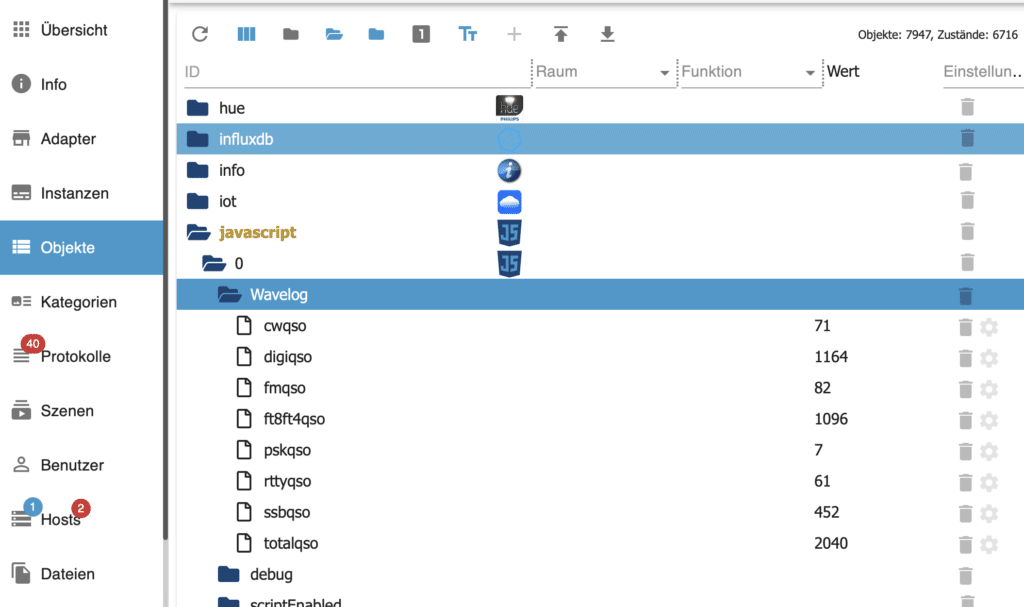
I have created my own data points for my QSO statistics in ioBroker. These record the total number of my QSOs as well as the sums of the QSOs in the SSB, FM, CW, RTTY, FT8, FT4, JS8 and PSK modes:
javascript.0.Wavelog.totalqso
javascript.0.Wavelog.SSB_QSOs
javascript.0.Wavelog.fmqso
javascript.0.Wavelog.rttyqso
javascript.0.Wavelog.ft8ft4qso
javascript.0.Wavelog.pskqso
javascript.0.Wavelog.digiqso
javascript.0.Wavelog.cwqso
javascript.0.Wavelog.js8qso
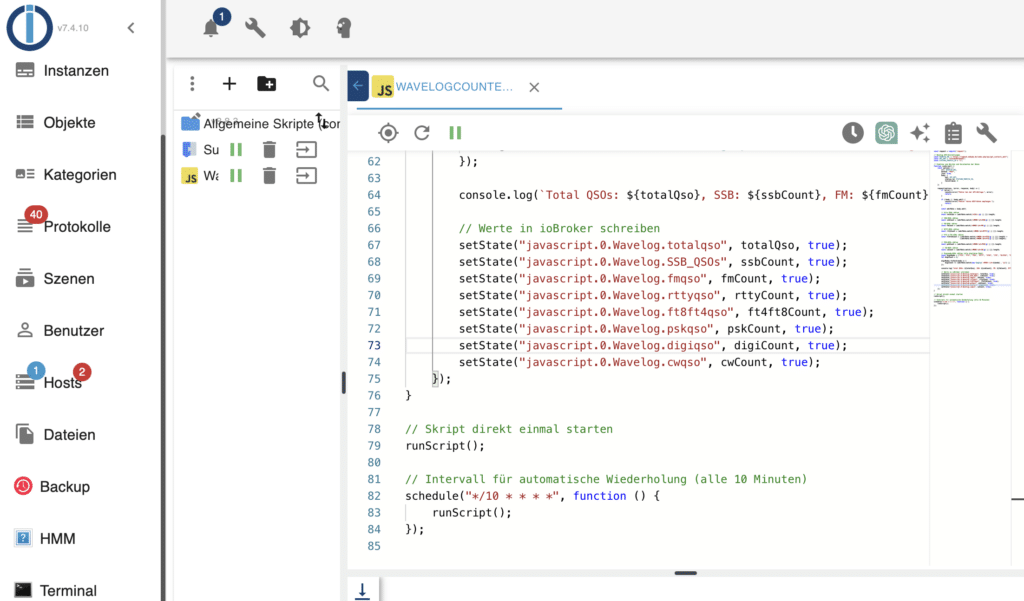
The following JavaScript is used within the JavaScript adapter of ioBroker and runs automatically every 10 minutes. The always up-to-date script can be found here on Github.
const request = require('request');

// Wavelog API-settings
const WAVELOG_URL = "https://urlzumlogbuch.de/index.php/api/get_contacts_adif";
const API_KEY = "demoapikey";
const STATION_PROFILE_ID = "1";

// Function for retrieving and processing data
function runScript() {
    const options = {
        url: WAVELOG_URL,
        method: "POST",
        json: true,
        body: {
            key: API_KEY,
            station_id: STATION_PROFILE_ID,
            fetchfromid: 0
        }
    };

    request(options, (error, response, body) => {
        if (error) {
            console.error("Error in API query:", error);
            return;
        }

        if (!body || !body.adif) {
            console.error("Error: No ADIF data received.");
            return;
        }

        const adifData = body.adif;

        // Count all QSOs
        const totalQso = (adifData.match(/<CALL:/g) || []).length;

        // Count SSB-QSOs
        const ssbCount = (adifData.match(/<MODE:\d+>SSB/g) || []).length;

        // Count FM-QSOs
        const fmCount = (adifData.match(/<MODE:\d+>FM/g) || []).length;

        // Count RTTY-QSOs zählen
        const rttyCount = (adifData.match(/<MODE:\d+>RTTY/g) || []).length;

        // Count FT4 & FT8 QSOs summed up
        const ft4ft8Count = ((adifData.match(/<MODE:\d+>FT8/g) || []).length) +
                            ((adifData.match(/<MODE:\d+>FT4/g) || []).length);

        // Count PSK-QSOs
        const pskCount = (adifData.match(/<MODE:\d+>PSK/g) || []).length;

         // Count CW-QSOs
        const cwCount = (adifData.match(/<MODE:\d+>CW/g) || []).length;

        // Count JS8-QSOs
        const cwCount = (adifData.match(/<MODE:\d+>JS8/g) || []).length;


        // Count Digimode-QSOs  (all digital Modes)
        const digiModes = ["FT8", "FT4", "PSK", "RTTY", "JT65", "JS8","JT9", "OLIVIA", "CONTESTI", "ROS"];
        let digiCount = 0;

        digiModes.forEach(mode => {
            digiCount += (adifData.match(new RegExp(`<MODE:\\d+>${mode}`, "g")) || []).length;
        });

        console.log(`Total QSOs: ${totalQso}, SSB: ${ssbCount}, FM: ${fmCount}, RTTY: ${rttyCount}, FT8+FT4: ${ft4ft8Count}, PSK: ${pskCount}, CW: ${cwCount}, JS8: ${js8Count}, Digi: ${digiCount}`);

        // Write values in io.Broker datapoints
        setState("javascript.0.Wavelog.totalqso", totalQso, true);
        setState("javascript.0.Wavelog.SSB_QSOs", ssbCount, true);
        setState("javascript.0.Wavelog.fmqso", fmCount, true);
        setState("javascript.0.Wavelog.rttyqso", rttyCount, true);
        setState("javascript.0.Wavelog.ft8ft4qso", ft4ft8Count, true);
        setState("javascript.0.Wavelog.pskqso", pskCount, true);
        setState("javascript.0.Wavelog.digiqso", digiCount, true);
        setState("javascript.0.Wavelog.cwqso", cwCount, true);
        setState("javascript.0.Wavelog.js8qso", cwCount, true);

    });
}

// Start Skript automatically
runScript();

// Automatic repeat interval (every 10 minutes)
schedule("*/10 * * * *", function () {
    runScript();
});
This script retrieves the current QSO statistics from Wavelog and saves them in the previously created data points in ioBroker.
Visualization on the Awtrix clock
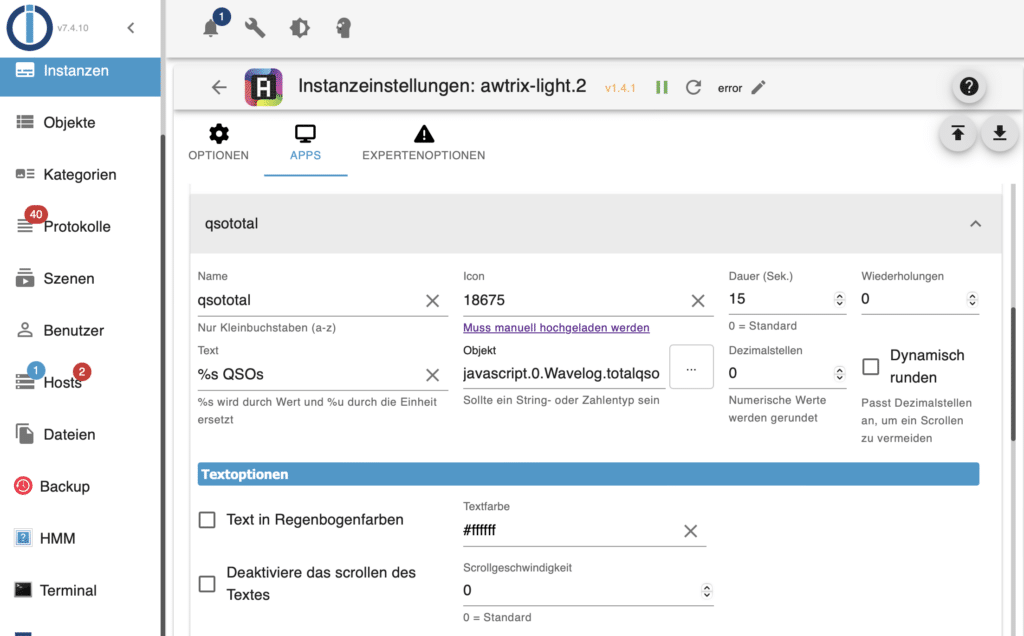
The ioBroker offers an Awtrix adapter with which the data from the created data points can be transferred to the Ulanzi TC001 Pixelclock. This can be defined here:
- Which values should be displayed
- Text color and display time
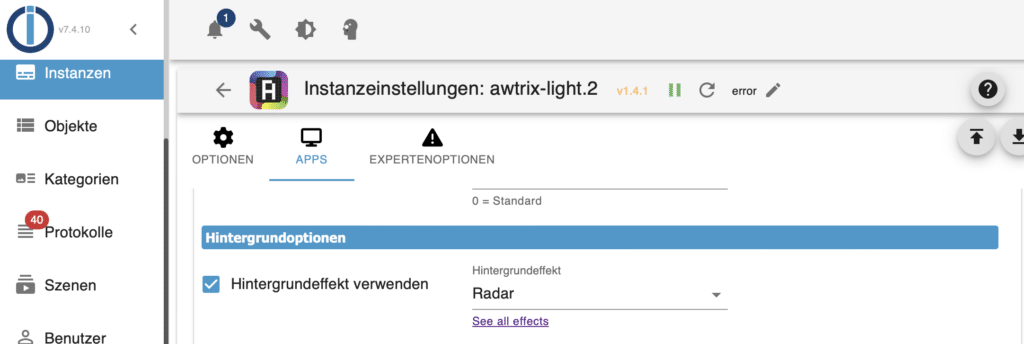
- Symbols and background animations
For example, the display can be configured so that the total number of QSOs and the totals per operating mode appear on the display on a rolling basis. Here is the configuration for the display of the data point “javascript.0.Wavelog.totalqso”:
Conclusion
With this solution I have realized a comfortable and automated display of my QSO statistics. The combination of Wavelog, ioBroker and the Awtrix clock enables simple visualization directly in the shack. This setup can be easily adapted and expanded, e.g. to include additional operating modes or filtering by band. This means that radio operation is not only well documented, but is also presented in a visually appealing way.